

Live View
Tracking Map
Geo Tracks creates your live view tracking map for free
For every event Geo Tracks produces a bespoke Live View Tracking Map free of charge.
Organisers send their GPX file and what 3 word’s references of their checkpoints and Geo Tracks does the rest.
The tracking map can be shared with participants by sharing the URL or Geo Tracks can provide the code for the map to be embedded in the event website. Live tracking is also available on our Geo Tracks app.


Participant information
Click on a participant tracker icon to activate their ‘pop up’.
See further details about their:
Name, nationality, category and club
Elapsed time, estimated time to next CP and to the finish. These are calculated relative to the GPX route provided by the event organiser
Progress on the route
Average speed
Battery level
W3W position (at that point in time). This provides a very quick way to relay their location to emergency services or someone trying to meet them on route
Breadcrumbs. Click the breadcrumbs icon to see all the tracker pings
Locate. Click this to zoom in on the location
Total hits. This shows the amount of times the tracker icon has been clicked on (to view the pop-up)

Live leader board
Click on the map and tracker icon on the left-hand side of the screen to display the live leaderboard (or use the burger on a mobile)
Shows position and order of participants
Name, nationality and bib number
Click on the orange download arrow to download the participant’s current GPX file or click on ‘Breadcrumbs’ to see all the GPS ping’s. Hover over a ping to see the date and time stamp
Check point times. Overall and splits. These update as the participants move along the course. The CP time stamp is taken from ‘CP Tick’ is shown on the map
Finish time. Once the participant has finished their final time will be shown
Please note the live leader board is an ‘extra’ paid-for feature (by the organiser) for providing event timing. See our ‘Event Timing’ Page HERE
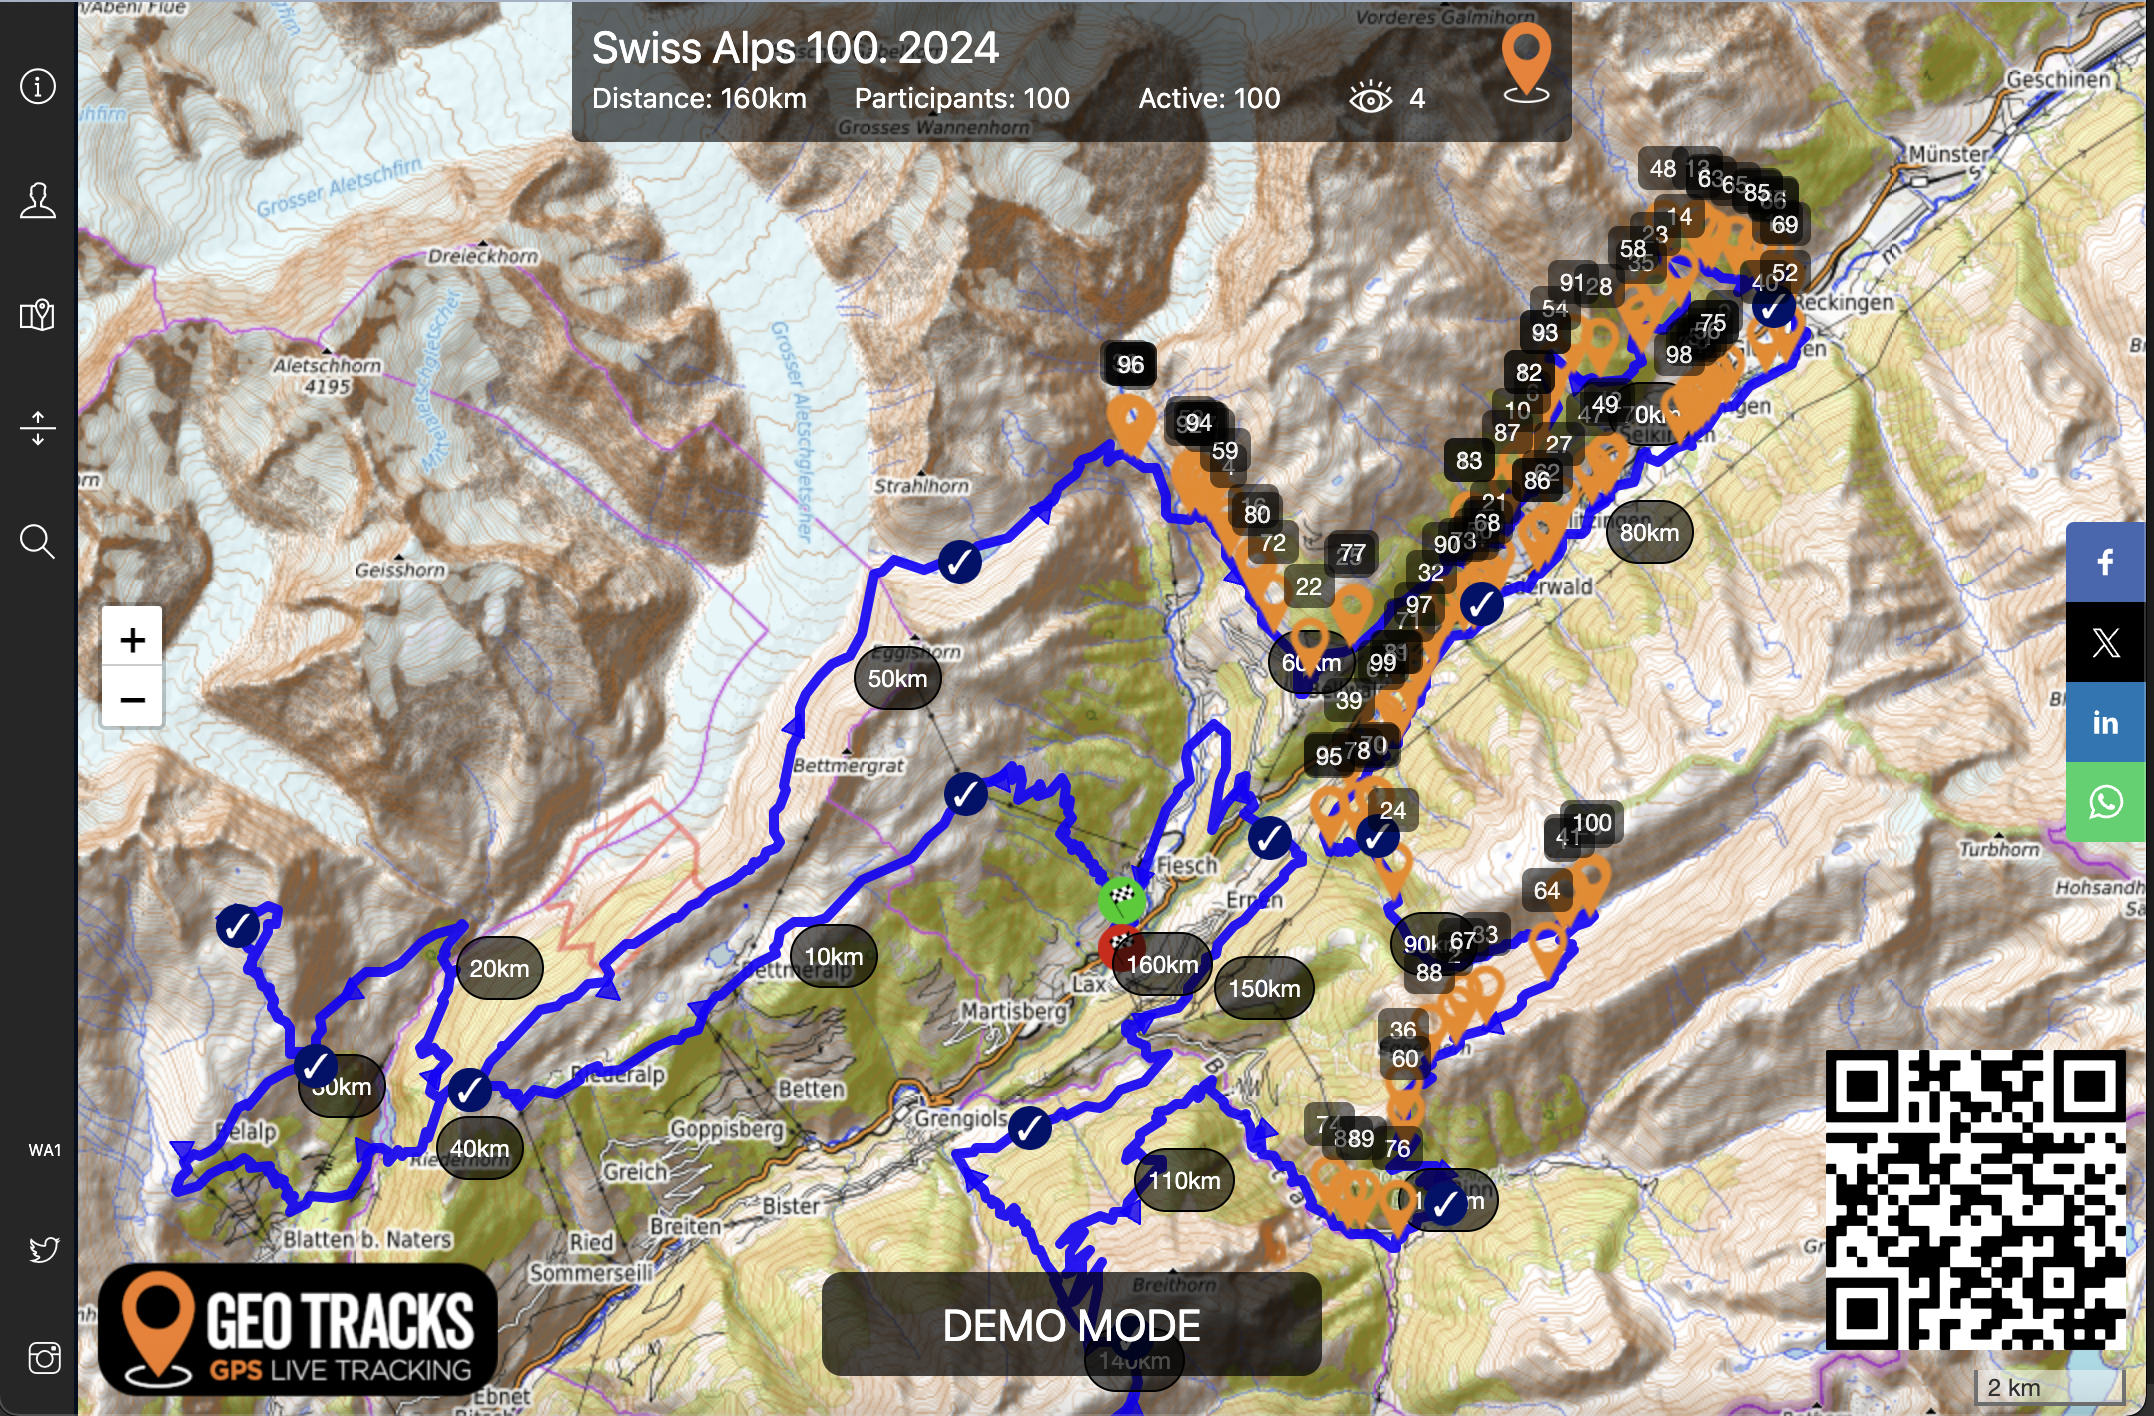
Live view tracking map
Click on the icons on the left-hand side of the screen (burger on mobile view)
See further details about:
Info button (I in a round circle). Shows basic information about the event
Participants (head on shoulders). Shows details on the event participants
Live leaderboard (icon on a folded map). Shows the live leaderboard and results page
Elevation
Top banner
Distance. Shows the total distance of the route (GPX file)
Participants. Shows how many participants were loaded up for event tracking
Active. Shows how many tracked participants are still on the map / active
Views (eye icon) show how many live viewers of the tracking map there is

elevation
Click on a participant tracker icon to activate their ‘pop up’.
Then click on the elevation button on the left-hand side of the screen (burger on the mobile)
The elevation line appears as a graph with distance on the bottom marked along the bottom
Having a participant pop up open and the elevation feature on enables the viewer to see where on the elevation chart the participant is
Elevation can also be activated as a stand-alone feature on the map

Bread crumbs
Click on a participant tracker icon to activate their ‘pop up’.
Use the breadcrumbs to see where a participant has been and view the time stamp
Click on the Bread crumbs button
Reduce the participant’s pop-up by selecting the down arrow
Zoom in on the map over the breadcrumbs to look at the route taken
Click a Bread crumb to see the time/date stamp at that location